


- More than half of the vessels operating in 2050 are expected to come from orders placed before 2035, making the coming decade a critical window for shipowners’ engine choices.
- Dual-fuel engines allow shipowners to switch between conventional fuels and the selected new fuel, but actual uptake of the latter will depend on whether it is cost-competitive once vessels are in service.
- New fuels could reach around 60% of fleet energy consumption under a sufficiently strong carbon price signal, modelled at USD 700/tCO2e by 2050.
- The overall cost of using e-methanol and e-ammonia is near parity through 2050.
Singapore, 17 September 2026 – With vessels operating for 25–30 years and only around 4% of the fleet renewed annually, newbuild decisions made over the coming decade will establish much of the engine capacity available in 2050.
Yet having the capacity to consume a new fuel does not guarantee its uptake. Dual-fuel engines allow shipowners to switch between conventional fuels and the selected new fuel as economics and regulations evolve; continued fuel competitiveness is therefore critical to what vessels ultimately consume.
These are among the findings of Navigating the maritime fuel transition: How fuel economics, regulations, and fleet decisions shape the future bunkering landscape, based on a model jointly developed by the Global Centre for Maritime Decarbonisation (GCMD) and Boston Consulting Group (BCG).
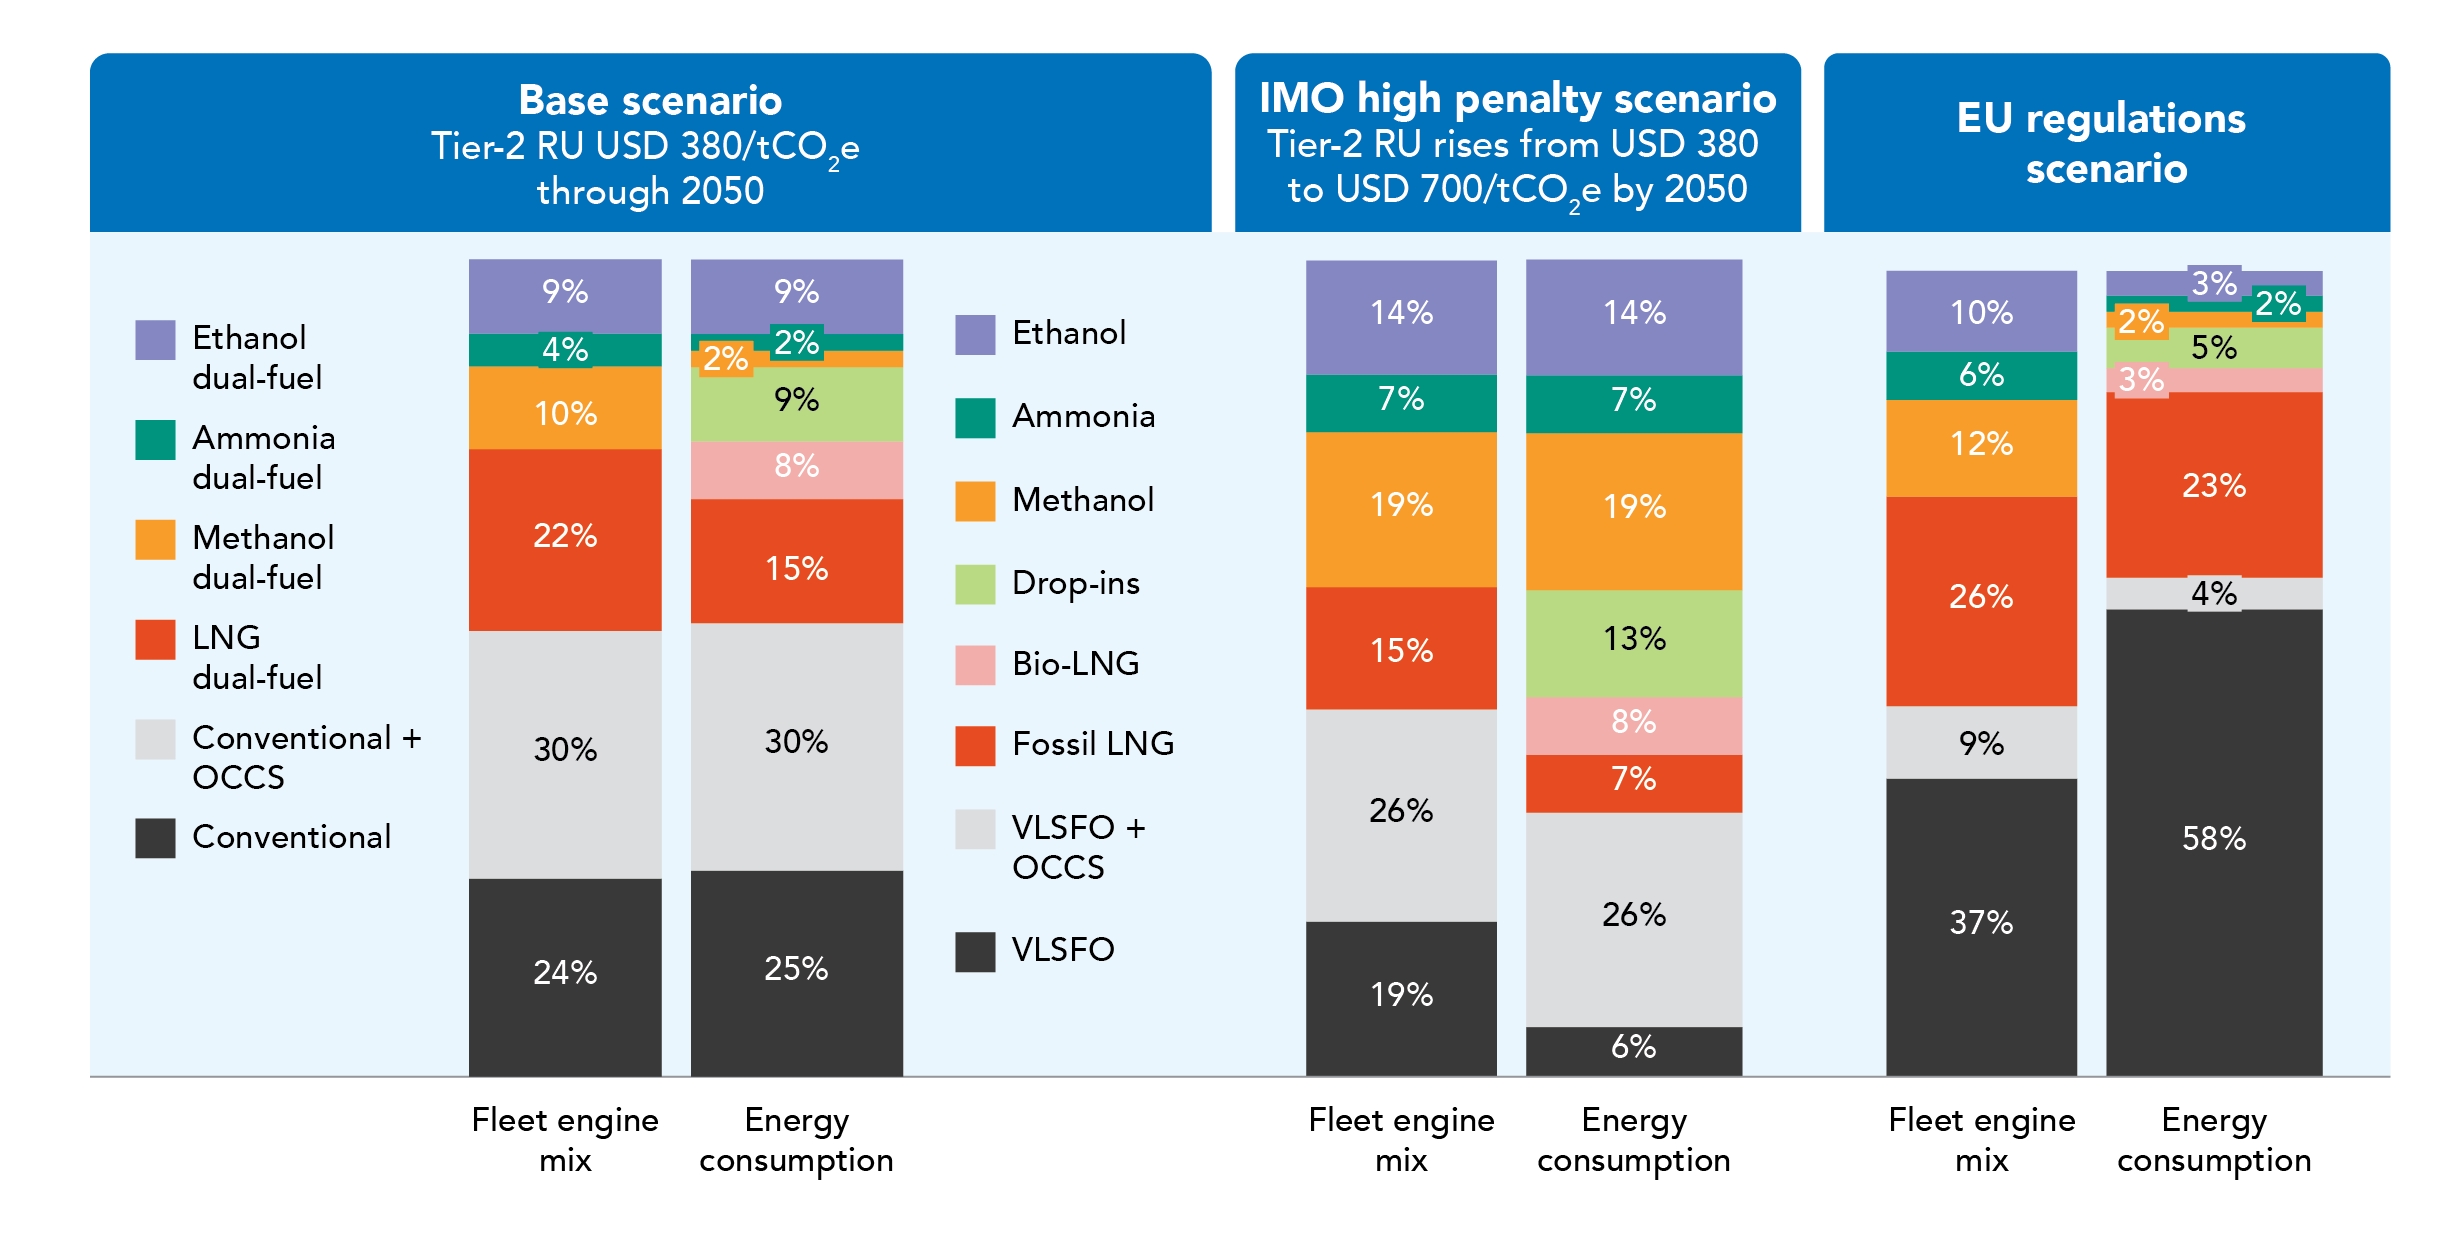
The model illustrates this dynamic in its base scenario. With the Tier-2 penalty under the IMO Net-Zero Framework held at USD 380/tCO2e through 2050, methanol dual-fuel engines account for around 10% of fleet engine capacity in 2050, but methanol represents just 2% of fleet energy consumption. With conventional fuels remaining more economical under this regulatory regime, methanol dual-fuel vessels continue to operate on fuels cheaper than methanol (Figure 1).
A global carbon price of USD 700/tCO2e materially changes the transition
The base scenario demonstrates how fuel economics can limit uptake even when vessels have the capacity to use new fuels. This picture changes if the IMO Tier-2 penalty rises to USD 700/tCO2e by 2050, at which point new fuels, including drop-ins, reach approximately 61% of fleet energy consumption (Figure 1).
By contrast, EU regulations alone will not drive a marked global shift, as they cover only around 20% of international shipping’s energy demand.
Overall cost of using e-methanol and e-ammonia is near parity
While a stronger global carbon price can accelerate the shift towards new fuels, the model does not point to a clear cost winner between e-methanol and e-ammonia.
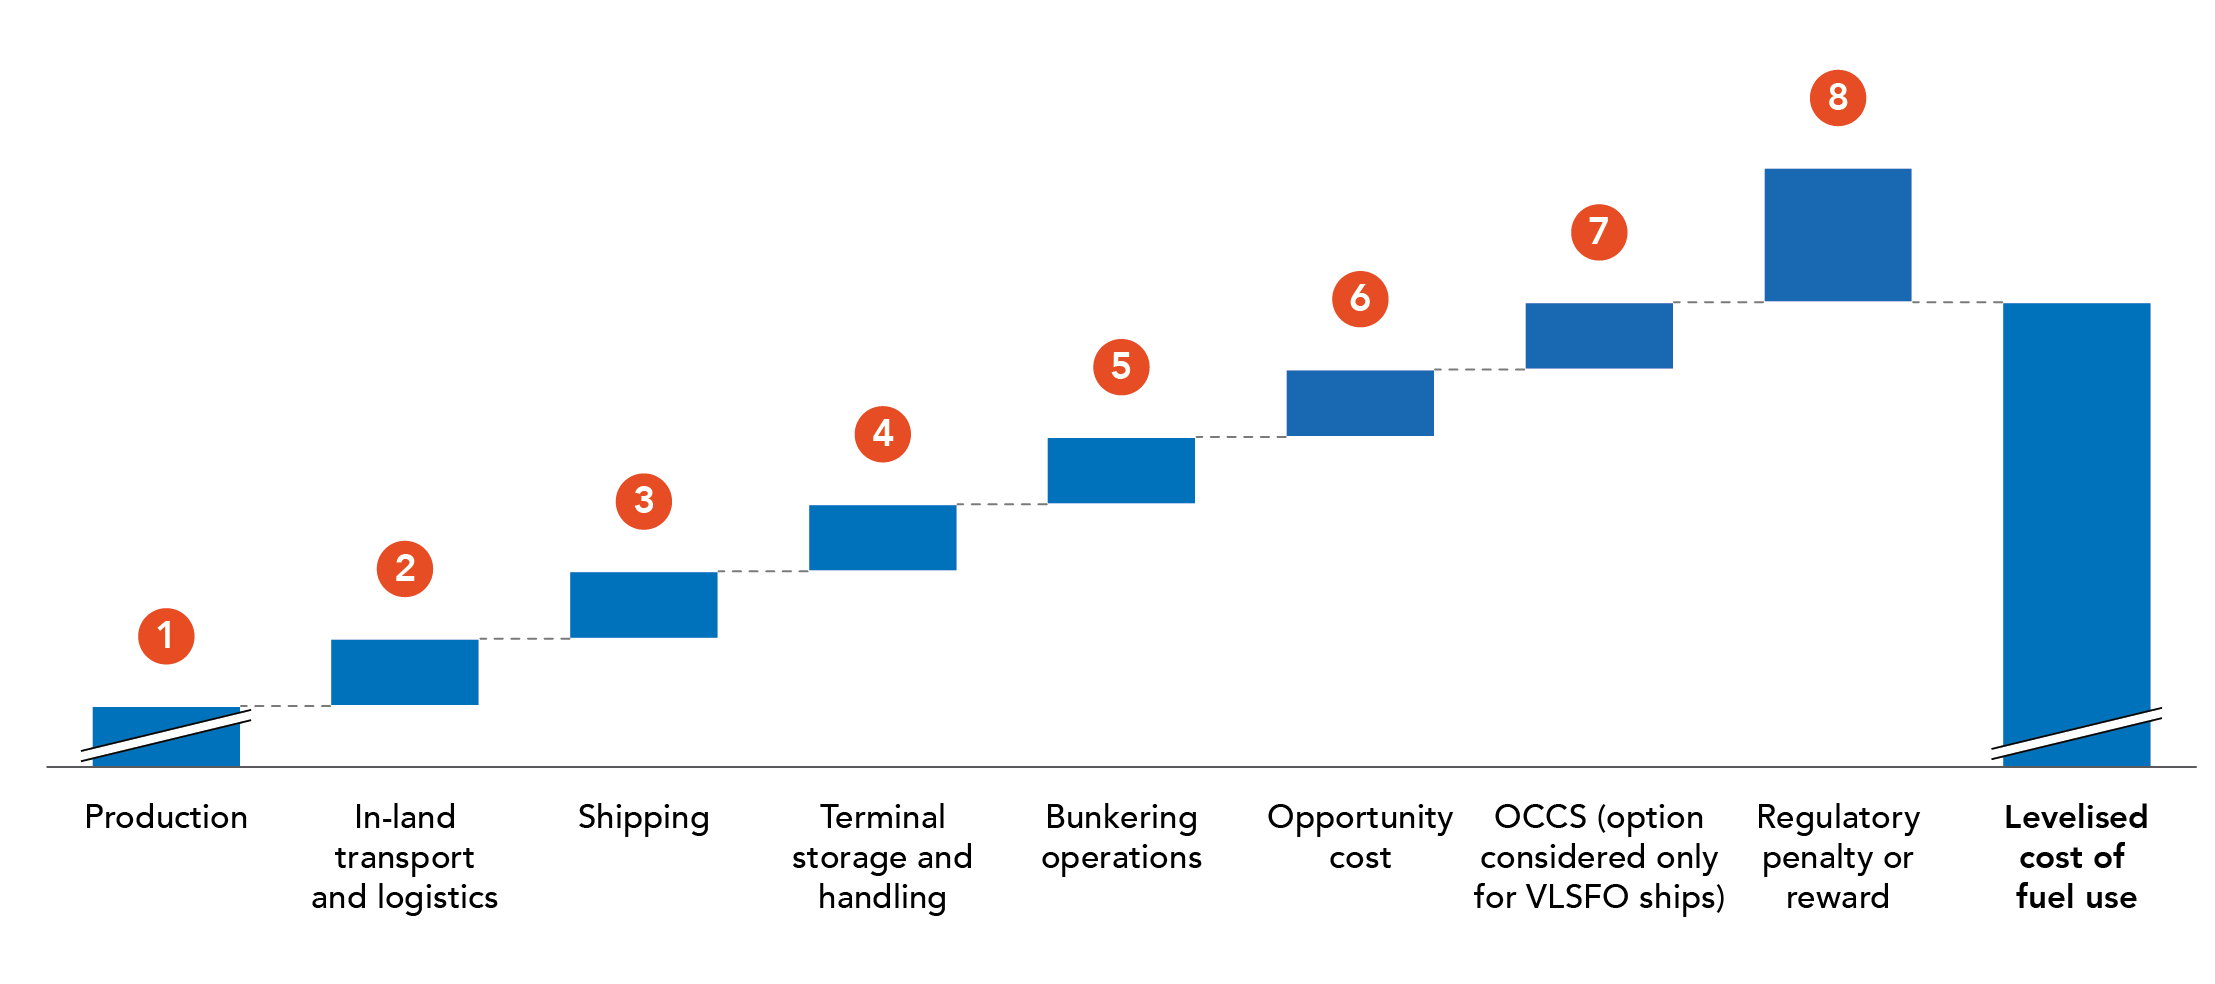
E-ammonia’s production cost advantage is largely offset by higher logistics costs arising from its toxicity, including specialised crew training, larger exclusion zones, and more complex bunkering. As a result, the overall cost (Figure 2) of using e-ammonia and e-methanol is near parity through to 2050.
Key uncertainties could reshape the competitiveness of other fuel pathways
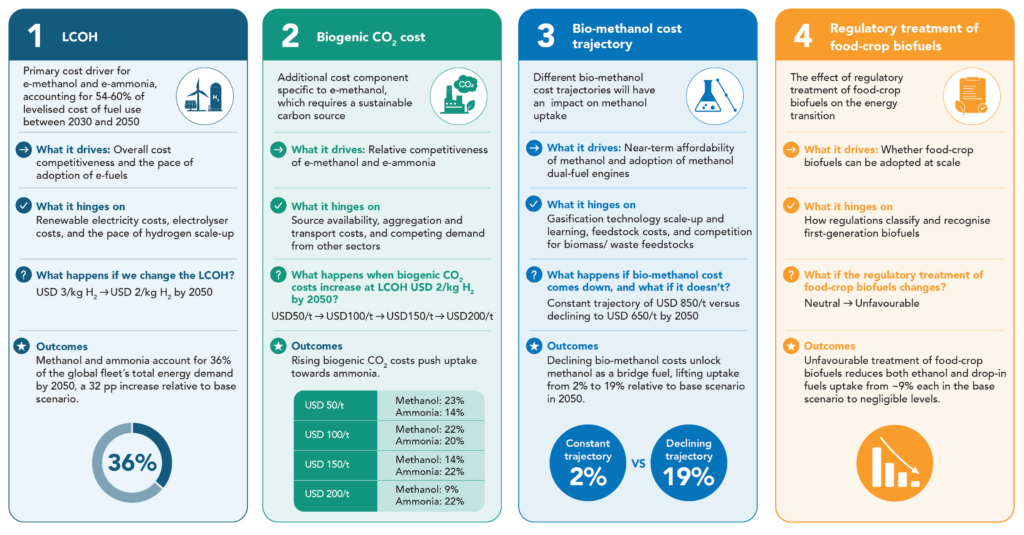
The model also identifies four key uncertainties that could impact the competitiveness of new fuel pathways. Ethanol, methanol, and ammonia each exhibit different sensitivities that provide signposts for how their competitiveness could evolve (Figure 3).
For e-methanol and e-ammonia, the levelised cost of hydrogen (LCOH) is a key sensitivity, while e-methanol is additionally sensitive to the cost of biogenic CO2. Both are closely linked to feedstock costs and availability and therefore affect fuel production costs. Bio-methanol cost trajectories, meanwhile, could influence the near-term uptake of methanol dual-fuel engines, with implications for longer-term engine technology lock-in. Ethanol adoption is sensitive to the regulatory treatment of food-crop biofuels (Figure 3).
The impact of these uncertainties can be significant. At an LCOH of USD 2/kg H2 by 2050, the model finds that methanol and ammonia together could account for 36% of global fleet energy demand, 32 percentage points (pp) higher than if LCOH were USD 3/kg H2.
At an LCOH of USD 2/kg H2, the cost of biogenic CO2 becomes an important determinant of the relative uptake of methanol and ammonia. As biogenic CO2 costs rise from USD 50/t to USD 150/t, methanol’s share falls from 23% to 14%, while ammonia’s rises from 14% to 22%.
Future bunkering hubs will evolve into distinct archetypes
These shifts in fuel competitiveness have implications beyond which fuels vessels consume. They will also influence where new fuels are bunkered and how the global bunkering landscape develops through 2050.
Liquid fuels, such as methanol and ethanol, are relatively straightforward to transport and bunker, and are therefore likely to reinforce established bunkering hubs.
Ammonia uptake, by contrast, could reshape the landscape significantly. Its handling requirements and higher transport costs could give rise to two hub archetypes: production-linked hubs that compete on access to low-cost fuel, and import-aggregation hubs that compete on scale by combining maritime demand with demand from adjacent industrial and power sectors.
For ports, competitiveness will therefore depend not only on fuel availability, but also on fuel costs, vessel traffic, and the ability to aggregate demand.
Many vessels ordered over the coming decade will still be operating in 2050. Shipowners are therefore making long-lived engine choices before the relative economics of future fuels are clear. Our modelling puts into perspective just how difficult closing the cost gap between new and conventional fuels will be. The carbon price required to close this gap is substantial. And achieving it will be particularly challenging in today’s geopolitical environment. Understanding the signposts that could change these economics will be critical to the decisions the industry makes today.
Professor Lynn Loo, CEO, GCMD
The maritime fuel transition is being shaped as much by policy and cost uncertainty as by technology readiness. Rather than offer a single prediction, our approach with GCMD maps how sensitive each fuel pathway’s competitive position is to a handful of critical variables — policy scenarios, key cost drivers, and potential restrictions. Our hope is that this gives shipowners, fuel suppliers, port operators, and infrastructure investors a practical tool to stress-test their own fuel strategies as conditions change.
Anand Veeraraghavan, Managing Director & Senior Partner, BCG
To access the report, please click here.
Explore the interactive dashboard to compare how different policy and cost assumptions affect engine adoption and fuel consumption through 2050 here.
